By Majid Farhadloo, and Shashi Shekhar, Department of Computer Science, University of Minnesota
Thanks to NTEP-DB 1.0 [1], the relational database we created for the National Turfgrass Evaluation Program (NTEP), obtaining turfgrass cultivars' data will soon be much easier. In addition, a user-friendly web application by U-Spatial allows homeowners, researchers, and other stakeholders to extract meaningful information from NTEP data in a variety of formats. For example, retailers can learn the best cultivars to stock in different store locations around the country.
The current NTEP database represents location using state names and site IDs within states that can be used to infer high-level geographic regions. It lacks fine-grain location and terrain information such as latitude, longitude, and local elevation. Incorporating spatial information into the database promises to greatly expand its capabilities, making it possible, for example, to detect hotspots of turf disease or stress within a trial, identify co-occurrences between disease and environmental conditions, and leverage machine learning to predict cultivar quality ratings [2]. In collaboration with the turfgrass research group at the University of Minnesota, we have explored ways to test how spatial data might enhance the value of the NTEP database. For example, turfgrass researchers have observed winter damage to cultivars located at lower elevations, which they attribute to temperature fluctuations and ice water accumulation in those areas. We decided to use this observation to test whether cultivar performance can be explained by elevation data.
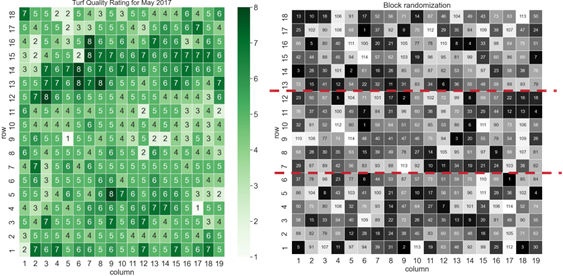
The turfgrass research group provided us with a test dataset from 2016 NTEP perennial ryegrass trial in Minnesota consisting of turfgrass quality ratings using a 1-9 scale (9=best turfgrass quality) that were taken during a single growing season (Figure 1a). The dataset is represented as a spreadsheet describing rows and columns for each cultivar, one cultivar to a cell. In field experiments, each site is partitioned into several replication blocks where each cultivar is evaluated in all the replications to minimize the random effect and account for spatial variability. Figure 1(b) shows the data divided into three blocks, representing the divisions of the test site locations. Cell values are the unique IDs of cultivars. Each cultivar is randomly assigned to a location in each block. For example, cultivar 91 can be found in the first block (row 1, column 2), the second block (row 10, column 2), and the third block (row 18, column 5).
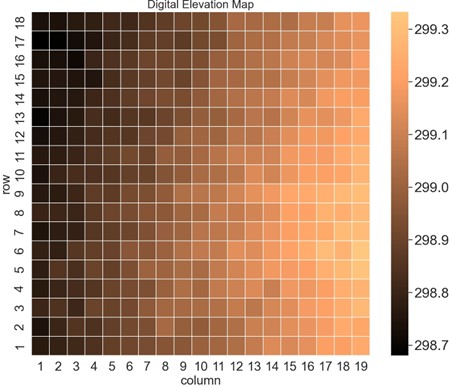
We supplemented the turfgrass dataset with spatial information, namely geo-coordinates from Google Maps and elevation information from LIDAR data collected by Minnesota Geospatial Commons [3]. Figure 2 maps the digital elevation for each cultivar at a given location, with darker and lighter colors indicating lower and higher elevations, respectively. Elevation data does not tell the complete story since it is difficult to identify a direct correlation between the elevation data and the turfgrass quality ratings. Therefore, we explored additional spatial data, including water flow direction and accumulation, to determine the correlation.
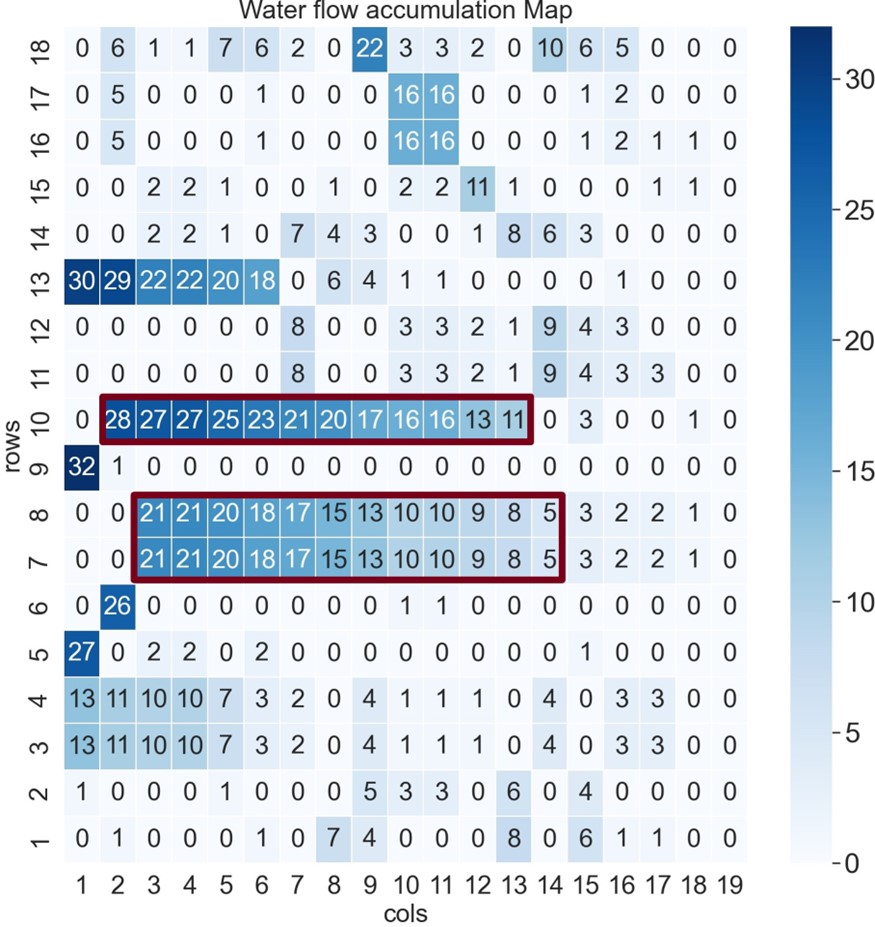
Flow direction is a required input to construct a flow accumulation map. It shows the direction (e.g., east, west, south) where water would flow if there is water across the study area. We used water flow direction to calculate flow accumulation values for the study area. The cell values in Figure 3 indicate the number of cells that flow into and accumulate in a catchment area. Since water accumulates in depressions in the ground, the flow accumulation data can be viewed as a map of landscape depression in the study area. Using all of this information, that is, turf quality ratings, elevation data, and flow accumulation data, we can evaluate a cultivar’s sensitivity to different growing conditions. It is also worth noting that flow accumulation information can help researchers identify specific areas in the plot area that might not provide reliable results as indicated in the bounding box in Figure 3.
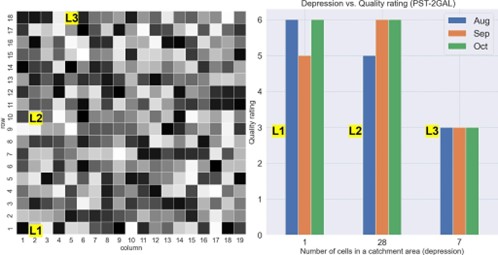
To test if a given cultivar's performance may be affected by elevation variation, we selected a cultivar grown in a depression, as indicated by its high cell value on the water flow accumulation map (row 10 and column 2 in Figure 3). This cultivar corresponds to cell 91, referred to in Figure 1(b) earlier. Figure 4 (a) shows the cultivar replicated in three test locations, L1, L2, and L3. We plotted the cultivar's ratings according to depression information (number of cells in the catchment area, Figure 3) for the three test locations to evaluate if depressions in the landscape influence the cultivar's performance. Figure 4(b) shows the cultivar ratings from August to October when the temperature progressively declines. In addition, with the advent of colder weather a region with a significant depression (i.e., L2) has a similar or relatively better quality rating compared to the flatter test regions (i.e., L1 or L3). This shows a simple illustrative example to help turfgrass researchers evaluate a cultivar's performance, where some cultivars may be less impacted by elevation variation in the landscape. We note supplementary data, including spatiotemporal and environmental information (e.g., more precise geo-coordinates, climatic data,) may be required to evaluate better and comprehend the cultivar's performance.
All spatial maps used in this analysis were created with ArcGIS software [4].
In conclusion, enhancing existing NTEP turfgrass data with fine-grain location and terrain information has the potential to provide spatial context (e.g., depressions) to improve the current understanding of turfgrass quality.
Resources for Further Exploration
- Xie, Yiqun, Majid Farhadloo, Ning Guo, Shashi Shekhar, Eric Watkins, Len Kne, Han Bao, Aaron J. Patton, and Kevin Morris. "NTEP‐DB 1.0: A relational database for the national turfgrass evaluation program." International Turfgrass Society Research Journal, Accepted on May 5th, 2021, DOI: 10.1002/its2.76.
- S. Shekhar and P. Vold. Chapter 5: Spatial Databases. In: Spatial Computing, The MIT Press Essential Knowledge series, MIT Press, Feb. 2020.
- Minnesota Geospatial Commons, 2021, https://www.mngeo.state.mn.us/chouse/elevation/lidar.html
- ArcGIS Pro, 2021, https://pro.arcgis.com/en/pro-app/2.8/help/layouts/create-a-map-series.htm


